Debug Toolbar
Use the Debug Toolbar to debug FSMs:

| # | Description |
|---|---|
| Error count. Click to open a finder window. | |
| Open the Debug Menu. | |
| Play controls: Play, pause, step. | |
| Show the FSM Log window for this FSM. | |
| Sync the selected state to activated states when playing. | |
| Show watched variables. Select variables to watch in the Variables Inspector |
Error Count
If the FSM has errors, the toolbar shows an error count and prev/next error buttons:

- Click the error count to open a finder window that shows all errors in the FSM.
- Ctrl-Click the error count to show all errors in the Project.
- Quickly select errors using the prev/next buttons.
Play Controls
The play controls work the same as Unity's play controls except for Step.
Step has options to step to the next state change instead of just the next frame. Set the step mode using the Debug Menu.
Debug Menu
| Command | Description |
|---|---|
| Enable Breakpoints | Enable/disable all breakpoints |
| Clear Breakpoints | Remove all breakpoints |
| Step Single Frame | Same as the normal Unity Step mode |
| Step To Next State Change in this FSM | Continue until the next state change in the FSM, then pause. |
| Step To Next State Change in any FSM | Continue until the next state change in any FSM, then pause. |
| Show State Loop Counts | Show loop counts above state nodes. These counts show the number of times the state was entered in the last update. |
| Open Log | Opens the FSM Log window for this FSM. |
Watch Variables
Variables marked as Watch in the Variables Inspector are shown in a debug panel:
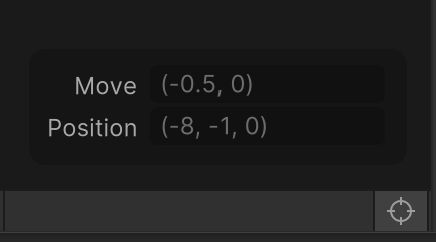
You can toggle the watch panel on/off while playing.
Shortcuts
Quickly cycle through errors:
Alt+Page Up to select previous error.
Alt+Page Down to select next error.
Customize Shortcuts
Prev/next error shortcuts can be customized in the Unity Shortcuts Window.
Select the PlayMaker category to see all customizable shortcuts.